9.5 KiB
Feature engineering
Defining the features
Feature engineering is handled within "feature_parameters":{} in the FreqAI config file and in the user strategy. The user adds all their base features, such as, e.g., RSI, MFI, EMA, SMA, etc., to their strategy. The base features can be custom indicators or they can be imported from any technical-analysis library that the user can find. The base features are added by the user inside the populate_any_indicators() method of the strategy by prepending indicators with %, and labels with &.
It is advisable for the user to start from the populate_any_indicators() in the example strategy (found in templates/FreqaiExampleStrategy.py) to ensure that they are following the correct conventions. Here is an example of how to set the indicators and labels in the strategy:
    def populate_any_indicators(
        self, pair, df, tf, informative=None, set_generalized_indicators=False
    ):
        """
        Function designed to automatically generate, name, and merge features
        from user-indicated timeframes in the configuration file. The user controls the indicators
        passed to the training/prediction by prepending indicators with `'%-' + coin `
        (see convention below). I.e., the user should not prepend any supporting metrics
        (e.g., bb_lowerband below) with % unless they explicitly want to pass that metric to the
        model.
        :param pair: pair to be used as informative
        :param df: strategy dataframe which will receive merges from informatives
        :param tf: timeframe of the dataframe which will modify the feature names
        :param informative: the dataframe associated with the informative pair
        :param coin: the name of the coin which will modify the feature names.
        """

        coin = pair.split('/')[0]

        if informative is None:
            informative = self.dp.get_pair_dataframe(pair, tf)

        # first loop is automatically duplicating indicators for time periods
        for t in self.freqai_info["feature_parameters"]["indicator_periods_candles"]:
            t = int(t)
            informative[f"%-{coin}rsi-period_{t}"] = ta.RSI(informative, timeperiod=t)
            informative[f"%-{coin}mfi-period_{t}"] = ta.MFI(informative, timeperiod=t)
            informative[f"%-{coin}adx-period_{t}"] = ta.ADX(informative, window=t)

            bollinger = qtpylib.bollinger_bands(
                qtpylib.typical_price(informative), window=t, stds=2.2
            )
            informative[f"{coin}bb_lowerband-period_{t}"] = bollinger["lower"]
            informative[f"{coin}bb_middleband-period_{t}"] = bollinger["mid"]
            informative[f"{coin}bb_upperband-period_{t}"] = bollinger["upper"]

            informative[f"%-{coin}bb_width-period_{t}"] = (
                informative[f"{coin}bb_upperband-period_{t}"]
                - informative[f"{coin}bb_lowerband-period_{t}"]
            ) / informative[f"{coin}bb_middleband-period_{t}"]
            informative[f"%-{coin}close-bb_lower-period_{t}"] = (
                informative["close"] / informative[f"{coin}bb_lowerband-period_{t}"]
            )

            informative[f"%-{coin}relative_volume-period_{t}"] = (
                informative["volume"] / informative["volume"].rolling(t).mean()
            )

        indicators = [col for col in informative if col.startswith("%")]
        # This loop duplicates and shifts all indicators to add a sense of recency to data
        for n in range(self.freqai_info["feature_parameters"]["include_shifted_candles"] + 1):
            if n == 0:
                continue
            informative_shift = informative[indicators].shift(n)
            informative_shift = informative_shift.add_suffix("_shift-" + str(n))
            informative = pd.concat((informative, informative_shift), axis=1)

        df = merge_informative_pair(df, informative, self.config["timeframe"], tf, ffill=True)
        skip_columns = [
            (s + "_" + tf) for s in ["date", "open", "high", "low", "close", "volume"]
        ]
        df = df.drop(columns=skip_columns)

        # Add generalized indicators here (because in live, it will call this
        # function to populate indicators during training). Notice how we ensure not to
        # add them multiple times
        if set_generalized_indicators:
            df["%-day_of_week"] = (df["date"].dt.dayofweek + 1) / 7
            df["%-hour_of_day"] = (df["date"].dt.hour + 1) / 25

            # user adds targets here by prepending them with &- (see convention below)
            # If user wishes to use multiple targets, a multioutput prediction model
            # needs to be used such as templates/CatboostPredictionMultiModel.py
            df["&-s_close"] = (
                df["close"]
                .shift(-self.freqai_info["feature_parameters"]["label_period_candles"])
                .rolling(self.freqai_info["feature_parameters"]["label_period_candles"])
                .mean()
                / df["close"]
                - 1
            )

        return df
In the presented example, the user does not wish to pass the bb_lowerband as a feature to the model,
and has therefore not prepended it with %. The user does, however, wish to pass bb_width to the
model for training/prediction and has therefore prepended it with %.
After having defined the base features, the next step is to expand upon them using the powerful feature_parameters in the configuration file:
    "freqai": {
        ...
        "feature_parameters" : {
            "include_timeframes": ["5m","15m","4h"],
            "include_corr_pairlist": [
                "ETH/USD",
                "LINK/USD",
                "BNB/USD"
            ],
            "label_period_candles": 24,
            "include_shifted_candles": 2,
            "indicator_periods_candles": [10, 20]
        },
        ...
    }
The include_timeframes in the config above are the timeframes (tf) of each call to populate_any_indicators() in the strategy. In the presented case, the user is asking for the 5m, 15m, and 4h timeframes of the rsi, mfi, roc, and bb_width to be included in the feature set.
The user can ask for each of the defined features to be included also for informative pairs using the include_corr_pairlist. This means that the feature set will include all the features from populate_any_indicators on all the include_timeframes for each of the correlated pairs defined in the config (ETH/USD, LINK/USD, and BNB/USD in the presented example).
include_shifted_candles indicates the number of previous candles to include in the feature set. For example, include_shifted_candles: 2 tells FreqAI to include the past 2 candles for each of the features in the feature set.
In total, the number of features the user of the presented example strat has created is: length of include_timeframes * no. features in populate_any_indicators() * length of include_corr_pairlist * no. include_shifted_candles * length of indicator_periods_candles
= 3 * 3 * 3 * 2 * 2 = 108.
Feature normalization
FreqAI is strict when it comes to data normalization. The train features are always normalized to [-1, 1] and all other data (test data and unseen prediction data in dry/live/backtest) is always automatically normalized to the training feature space according to industry standards. FreqAI stores all the metadata required to ensure that test and prediction features will be properly normalized and that predictions are properly denormalized. For this reason, it is not recommended to eschew industry standards and modify FreqAI internals - however - advanced users can do so by inheriting train() in their custom IFreqaiModel and using their own normalization functions.
Data dimensionality reduction with Principal Component Analysis
The user can reduce the dimensionality of their features by activating the principal_component_analysis in the config:
    "freqai": {
        "feature_parameters" : {
            "principal_component_analysis": true
        }
    }
This will perform PCA on the features and reduce their dimensionality so that the explained variance of the data set is >= 0.999. Reducing data dimensionality makes training the model faster and hence allows for more up-to-date models.
Inlier metric
The inlier_metric is a metric aimed at quantifying how similar a the features of a data point are to the most recent historic data points.
The user defines the lookback window by setting inlier_metric_window and FreqAI computes the distance between the present time point and each of the previous inlier_metric_window lookback points. A Weibull function is fit to each of the lookback distributions and its cumulative distribution function is used to produce a quantile for each lookback point. The inlier_metric is then computed for each time point as the average of the corresponding lookback quantiles.
FreqAI adds the inlier_metric to the training features and hence gives the model access to a novel type of temporal information.
This function does not remove outliers from the data set.
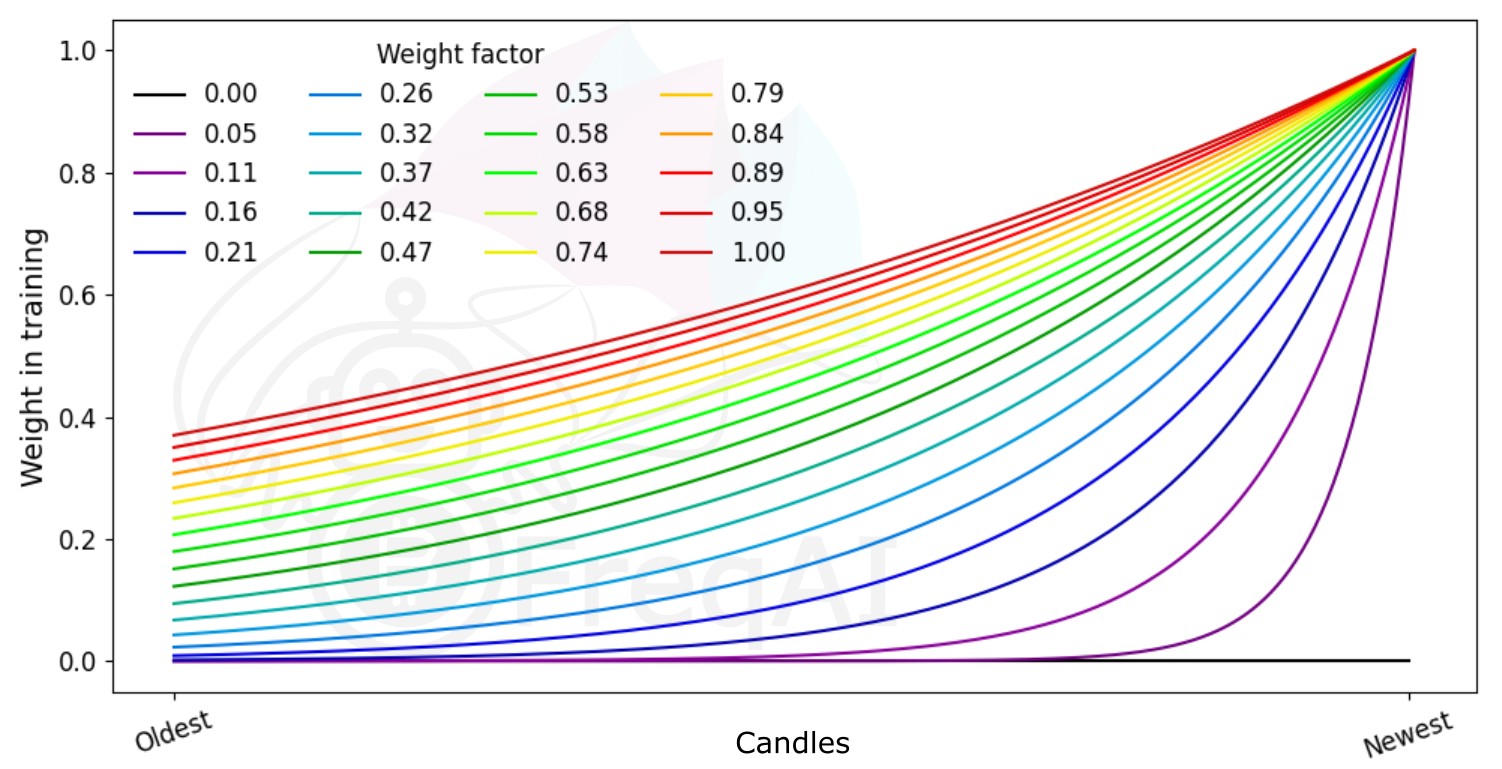
Weighting features for temporal importance
FreqAI allows the user to set a weight_factor to weight recent data more strongly than past data via an exponential function:
W_i = \exp(\frac{-i}{\alpha*n}) where W_i is the weight of data point i in a total set of n data points. Below is a figure showing the effect of different weight factors on the data points in a feature set.