It's almost no possible monitoring solution which it's OK to stop monitoring server itself upon a problem.

Signed-off-by: Amin Vakil <info@aminvakil.com>
Compose sample
Prometheus & Grafana
Project structure:
.
├── docker-compose.yml
├── grafana
│   └── datasource.yml
├── prometheus
│   └── prometheus.yml
└── README.md
version: "3.7"
services:
  prometheus:
    image: prom/prometheus
    ...
    ports:
      - 9090:9090
  grafana:
    image: grafana/grafana
    ...
    ports:
      - 3000:3000
The compose file defines a stack with two services prometheus and grafana.
When deploying the stack, docker-compose maps port the default ports for each service to the equivalent ports on the host in order to inspect easier the web interface of each service.
Make sure the ports 9090 and 3000 on the host are not already in use.
Deploy with docker-compose
$ docker-compose up -d
Creating network "prometheus-grafana_default" with the default driver
Creating volume "prometheus-grafana_prom_data" with default driver
...
Creating grafana    ... done
Creating prometheus ... done
Attaching to prometheus, grafana
Expected result
Listing containers must show two containers running and the port mapping as below:
$ docker ps
CONTAINER ID        IMAGE               COMMAND                  CREATED             STATUS              PORTS                    NAMES
dbdec637814f        prom/prometheus     "/bin/prometheus --c…"   8 minutes ago       Up 8 minutes        0.0.0.0:9090->9090/tcp   prometheus
79f667cb7dc2        grafana/grafana     "/run.sh"                8 minutes ago       Up 8 minutes        0.0.0.0:3000->3000/tcp   grafana
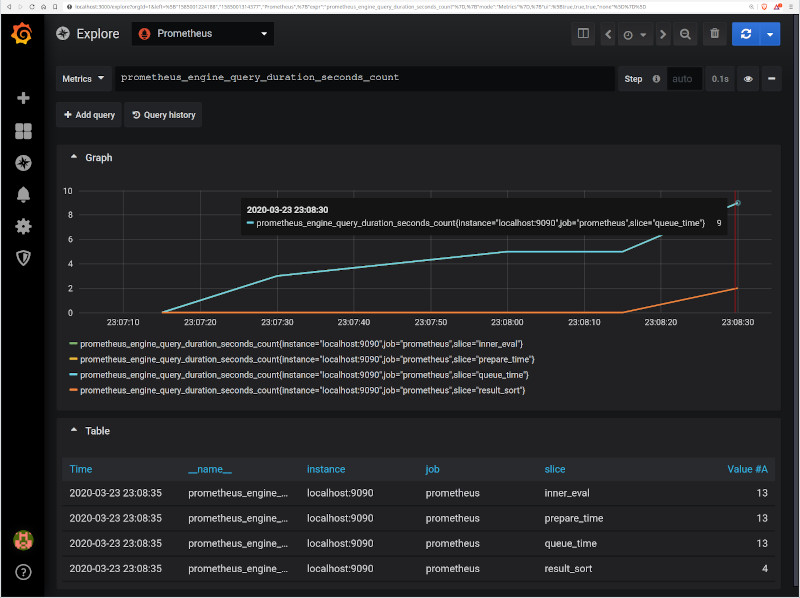
Navigate to http://localhost:3000 in your web browser and use the login credentials specified in the compose file to access Grafana. It is already configured with prometheus as the default datasource.
Navigate to http://localhost:9090 in your web browser to access directly the web interface of prometheus.
Stop and remove the containers. Use -v to remove the volumes if looking to erase all data.
$ docker-compose down -v
